Scientific method, team dynamics, and project datasets
Luke Johnston
Lesson preamble:
Lesson objectives:
- Learn about the scientific method and applying it
- Learn basics of group dynamics in a team setting
- Get into your groups, start your projects - Identify which dataset to use - Brainstorm possible research questions
Lesson outline:
- What is the scientific method (20 min)
- Team dynamics and assigning roles and tasks (15-20 min)
- Getting into groups (10 min)
- Exercise (25-30 min)
- Start project work (20-25 min)
- Datasets available for use (10-20 min)
Scientific method
Simplified diagram of the scientific method
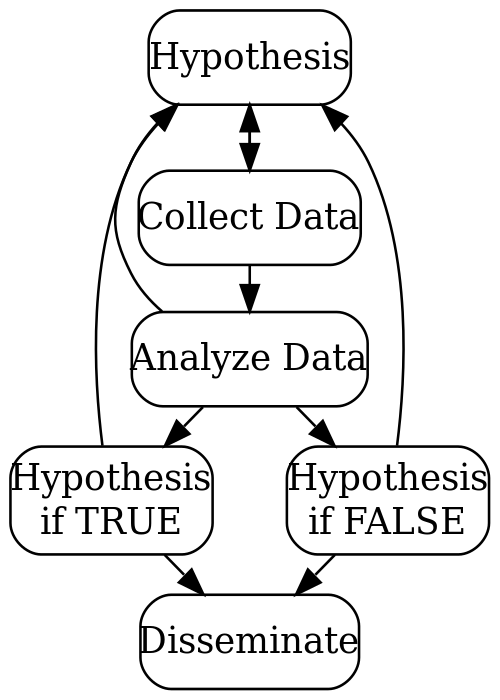
Simplified process flow for the scientific method
Steps in the scientific process1
- Identify research question(s).
- Look into what the previous literature shows.
- Create one or more hypotheses or objectives.
- Write up an outline or expected approach to answering those questions/objectives (analysis and presentation plan):
- How will the data be obtained and what is the data (i.e. the source)?
- What statistical/mathematical techniques have previous researchers used? Will you use them? Are they appropriate (optional, may need expert)?
- How will the results/data be presented or visualized (possible tables/figures)?
- Run the planned analyses (or additional ones that come may up).
- Visualize or present all results from the analyses.
- Interpret the results and how they fit with the previous literature.
- Draw conclusions based on the hypotheses/objectives.
- Disseminate your results (in blogs, pre-print archives, journals, conferences)
Team dynamics
Basics of succeeding as a team
Final assignment is in a group and to succeed, you need to understand team dynamics:
- Communication is vital to work together and to achieve the goal
- Teams go through various stages
- Need consensus for group norms, goals, duties/responsibilities, and conduct/behaviour
- Important that everyone has a stake in the project
- Rotate roles (specifically for the leader/facilitator)
Stages of group formation
- “Forming-Storming-Norming-Performing-Adjourning Model”2
- Essentially, groups go through stages (not always all and not always in order):
- Getting to know one other
- Feeling comfortable and safer, testing boundaries
- Opening up, voicing opinions, potential for conflict (which can be good!)
- Stronger bonds form, cooperative
- Greater focus and energy on completion of project
- Team ends after project is successfully completed
- These stages can be fast-tracked by discussing norms, duties, and conduct early on
Roles and responsibilities
- Leader/Facilitator’s duty:
- Goal is to keep things running smoothly, focused on the task, and on track for time
- Keep everyone on topic and on task; stay aware of the time
- (Try to) mediate or resolve any conflicts (there will always be some type of conflict; how it’s dealt with is what matters)
- (Try to) encourage everyone to participate and allow everyone a chance at talking
- Recorder’s duty:
- Goal is to write/type down main or important points raised or discussed when team is meeting
- Keep notes and files organized and orderly
- Organizer’s duty:
- Arrange for next meeting time and location
- Send reminders to members a day or two before meeting
- Make and email a simple agenda of tasks to do or to discuss
Code of conduct
- Vital to establishing boundaries and expectations of being a team member
- How do you want each member to treat each other?
- How do you deal with conflict?
- What is acceptable and unacceptable behaviour?
- These are outlined in the code of conduct
- Mostly its common sense (be kind and respectful)
- But its important that you as a team write out what everyone wants and agrees to
Example Code of Conduct:
Exercise
As a group, complete these tasks
- Get into your groups
- Introduce each other:
- Find out everyone’s name and year of study
- Find out other things about each other (e.g. any plans for next year, etc)
- Create a one or two word “team name”. We’ll use this to create a shared folder for everyone to use.
- Assign roles to each person (these roles will be rotated in every group setting):
- You need: facilitator, recorder, organizer
- Discuss how and when roles will be rotated (record it)
- Discuss and brainstorm some codes of conduct you want your team to follow (record it)
- Take a few minutes, think about your own skills and what you feel are most competent in
- Then, share the top one or two of those skills (record those skills)
- Discuss how responsibilities of each member will be decided on (record it)
Starting the projects
Datasets available for use
Continuous Plankton Recorder Dataset
Data on northern hemisphere plankton species, latitude, longitude, date. Going back to 1946. 935 Mb size, almost 2.75 million rows of data.
-
Data on insects species in Costa Rica, latitude, longitude, elevation, date. 1.4 Gb size, almost 3.25 million rows of data.
Marine predator and prey body sizes
Data from 27 different global locations on species, body measurements, latitude, longitude, date. 21 Mb, almost 35,000 rows of data (in long format).
-
Data about general mammalian life history with species, body size, lifespan, litter size, and other reproductive variables. 150 Kb size, 1440 rows of data.
North American Bird Breeding Survey
Data about number of birds at multiple stops in North America. Many datasets of varying rows that need to be linked together. ~5.7 Gb size (can be shortened) across >50 files.
National Ecological Observatory Network
A repository of many large scale ecological datasets from a variety of systems collected over multiple years at at approximately 50 sites in the USA. Feel free to browse the datasets for ones of interest to you, but I have highlighted a few below.
- Ground beetles in pitfall traps: ~26 Mb .csv file with ID of ground beetle species from 40 traps arrayed in each of ~50 NEON sites since 2013.
- Macroinvertebrate collection: ~9 Mb .csv file with ID’s of benthid macroinvertebrates from lakes, non-wadeable streams, and wadeable streams from sites across the NEON network dating back to 2014.
- Plant presence/absence and percent cover: Presence/absence and percent cover of species in 10m2, 100m2, and 400m2 quadrats from multiple plots in each of 50 NEON sites dating back to 2013. This is the dataset we worked with in lecture 9.
US EPA National Aquatic Resource Surveys
Numerous datasets from annual surveys of aquatic habitats conducted by the US Environmental Protection Agency. Includes data relating to the physical environments (e.g. water quality, chemical properties, landscape variables, etc.) to the biotic environment (e.g. phytoplankton concentrations, benthic macroinvertebrates, etc.). Be sure to download the metadata as well, which is on the same page linked above.
International Council for the Exploration of the Sea
Many large datasets from fish oceanic fish surveys. Includes oceanographic data in addition to biodiversity datasets, fish stomach content data, physical environmental condition and contaminants, predation, etc.
Alberta Ecological Information System
Data on vegetation and soil plots in Alberta. Over 26 000 sites are available.
Beaver abundance and distribution
Aerial and ground surveys of beaver abundance, feeding, and lodge distribution in Elk Island National Park starting in 1959.
Benthic invertebrate abundance in Ivvavik, Tuktut, and Aulavik
Counts of benthic invertebrate taxa from 3 river corridors from 2009 to 2015. Recommended to use all 3 datasets.
Red-backed salamander abundance
Abundance of red-backed salamanders from 4 sites in the Bruce Peninsula from 2004 to 2017.
In addition to the datasets shown above, we encourage students to bring their own datasets for use in their group projects.
Example hypotheses with figures
Simple hypothesis: Bigger predators eat bigger prey.
Easy to identify independent and dependent variables and visualize with plots and test with linear regression.
Advanced hypothesis: Which characteristics determine prey size among marine predators?
Lots of possible groupings available. Start with visualizing some good candidate variables such as predator weight and length. Realize that the relationship is more complex than this and start dividing the data set according to species, water temperature, weather, etc. Use a combination of visualization and regression analyses. Fit models to the data to determine which types of regressions are appropriate.
# Read data online and fix colnames
pred_prey <- read_tsv('http://www.esapubs.org/archive/ecol/E089/051/Predator_and_prey_body_sizes_in_marine_food_webs_vsn4.txt')
## Parsed with column specification:
## cols(
## .default = col_character(),
## `Record number` = col_double(),
## `Individual ID` = col_double(),
## `Predator length` = col_double(),
## `Predator standard length` = col_double(),
## `Predator fork length` = col_double(),
## `Predator total length` = col_double(),
## `Standardised predator length` = col_double(),
## `Predator quality of length-mass conversion` = col_double(),
## `Predator mass` = col_double(),
## `Predator mass check` = col_double(),
## `Predator mass check diff` = col_double(),
## `Predator ratio mass/mass` = col_double(),
## `SI predator mass` = col_double(),
## `Prey length` = col_double(),
## `Prey quality of conversion to length` = col_double(),
## `SI prey length` = col_double(),
## `Prey mass` = col_double(),
## `Prey mass check` = col_double(),
## `Prey mass check diff` = col_double(),
## `Prey ratio mass/mass` = col_double()
## # ... with 7 more columns
## )## See spec(...) for full column specifications.colnames(pred_prey) <- tolower(gsub(' ', '_', colnames(pred_prey)))
# Only adults and some columns of interest
adult_pred_food <- pred_prey %>%
mutate(predator_lifestage = tolower(predator_lifestage)) %>% # Mix of upper and lower case...
filter(predator_lifestage == 'adult') %>%
select(predator_common_name, predator_length, prey_mass, predator_mass)
# Summarize data to plot
plot_data <- adult_pred_food %>%
group_by(predator_common_name) %>%
summarize(
mean_pred_mass = mean(predator_mass),
mean_prey_mass = mean(prey_mass),
mean_pred_length = mean(predator_length)) %>%
filter(mean_pred_mass < 8000) # "outliers"
# Plot pred weight vs prey weight
ggplot(plot_data, aes(x = mean_pred_mass, y = mean_prey_mass)) +
geom_point() +
geom_smooth()## `geom_smooth()` using method = 'loess' and formula 'y ~ x'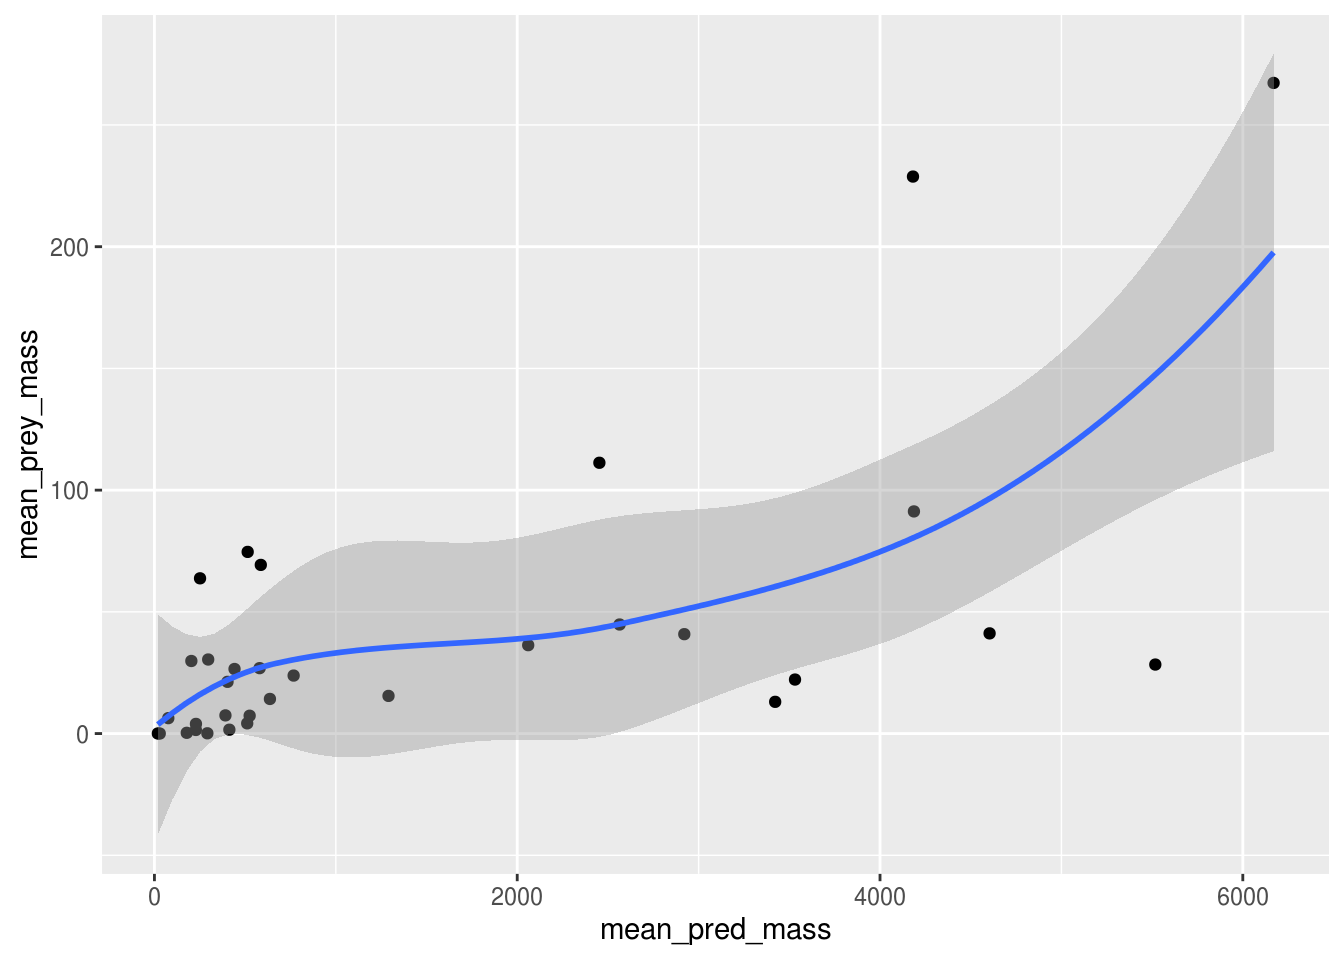
# Plot pred length vs prey weight
ggplot(plot_data, aes(x = mean_pred_length, y = mean_prey_mass)) +
    geom_point() +
    geom_smooth()
## `geom_smooth()` using method = 'loess' and formula 'y ~ x'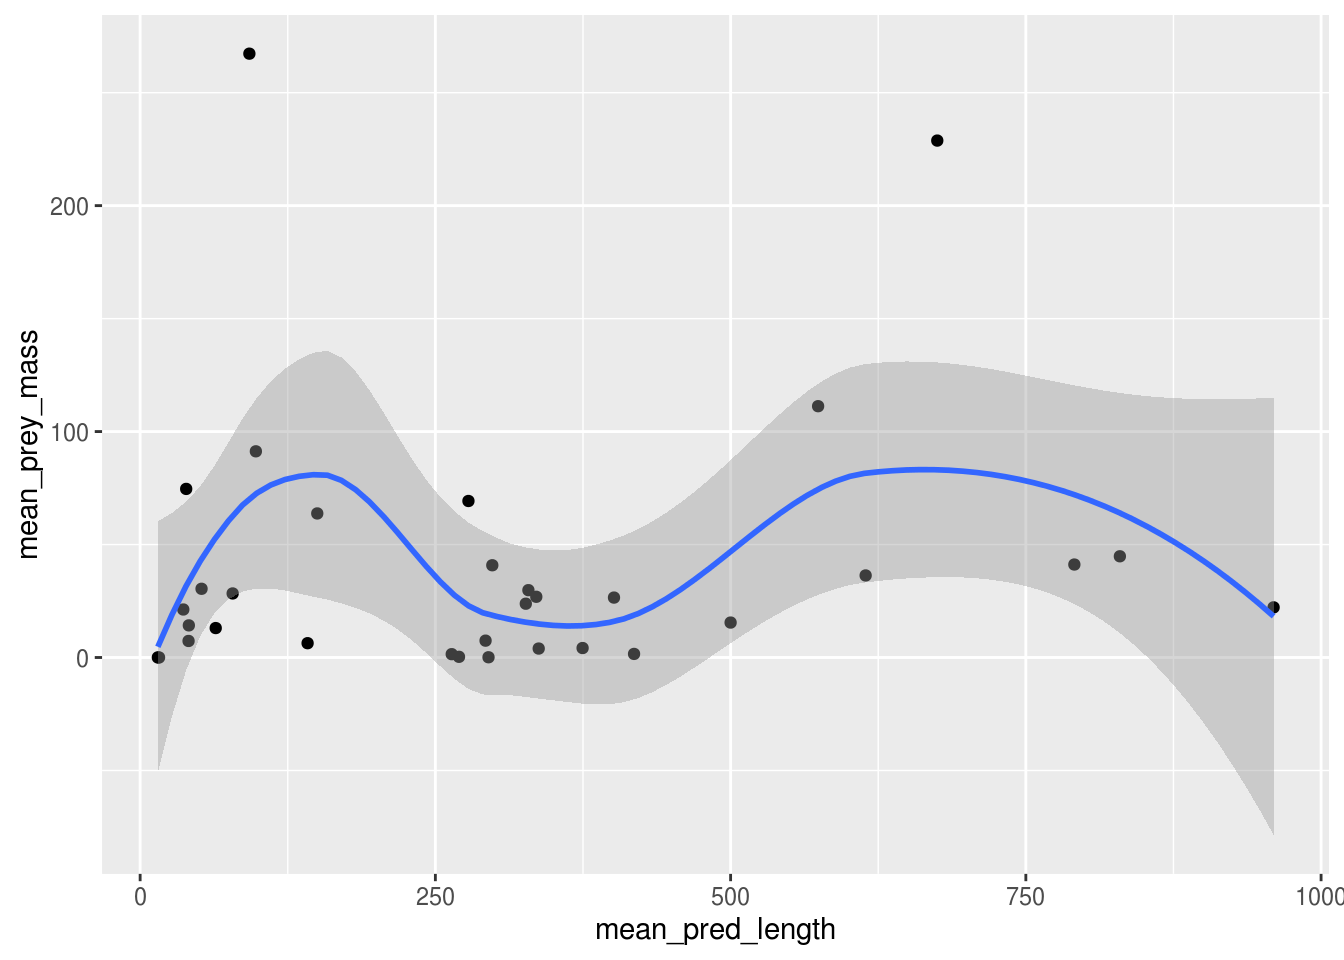
As a group, complete these tasks
In your group, rotate roles (need a facilitator and recorder at minimum). Before the end of class, finish these:
- Choose two possible datasets (or more) your team would like to work from (can also be datasets not presented in class) (record them)
- Look into the data documentation, see what type of variables there are, what published articles are available.
- Then, brainstorm as many research questions as possible for those two datasets (record them)
- Goal is to write down as many ideas as possible
- No question is off limits and no question is too simple or too complex!
- (You might combine or split questions later, just get whatever down!)
- Just write what ever comes to mind, whether it is an idea or not. Just start writing!
Make sure to record everything down! Many of these tasks will also be part of your mid-project update!
Set up GitHub account
Before we finish the class, we need to prepare a bit for next class. We need to create a GitHub account!
See Khan Academy on Scientific Method for a brief overview and explanation on the scientific process.↩
This work is licensed under a Creative Commons Attribution 4.0 International License. See the licensing page for more details about copyright information.