Introduction to ggplot2
- Author: Lindsay Coome
- Lesson Topic: Plotting in R using ggplot2
- Study Materials
- Lesson video stream: https://www.youtube.com/watch?v=EKkpflv-O_k
WHAT IS GGPLOT?
ggplot2 is meant to be an implementation of the Grammar of Graphics, hence gg-plot. The basic notion is that there is a grammar to the composition of graphical components in statistical graphics, and by directly controlling that grammar, you can generate a large set of carefully constructed graphics tailored to your particular needs. Each component is added to the plot as a layer.
COMPONENTS OF A GGPLOT2 PLOT
Plots convey information through various aspects of their aesthetics. Some aesthetics that plots use are:
- x position
- y position
- size of elements
- shape of elements
- color of elements
The elements in a plot are geometric shapes, like
- points
- lines
- line segments
- bars
- text
Some of these geometries have their own particular aesthetics. For instance:
points
- point shape
- point size
lines
- line type
- line weight
bars
- y minimum
- y maximum
- fill color
- outline color
text
- label value
##LET’S GET STARTED!
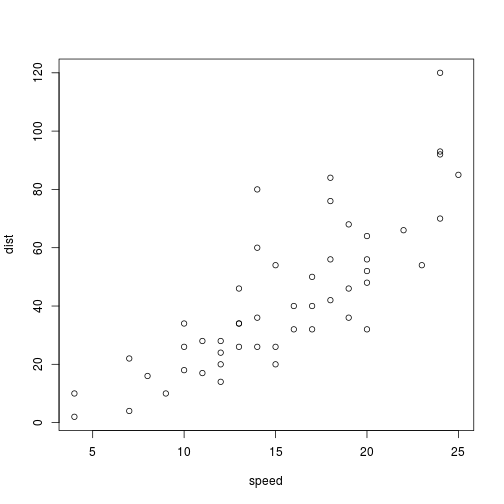
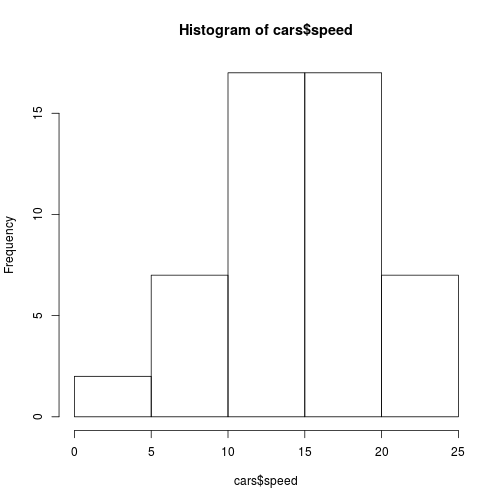
Here is an example of the base plotting functions in R:
plot(cars)
hist(cars$speed)
But ggplot2 plots are prettier…
We’ll investigate the dataset we’re going to use to make some graphs….
library(ggplot2)
str(diamonds)
## Classes 'tbl_df', 'tbl' and 'data.frame':	53940 obs. of  10 variables:
##  $ carat  : num  0.23 0.21 0.23 0.29 0.31 0.24 0.24 0.26 0.22 0.23 ...
##  $ cut    : Ord.factor w/ 5 levels "Fair"<"Good"<..: 5 4 2 4 2 3 3 3 1 3 ...
##  $ color  : Ord.factor w/ 7 levels "D"<"E"<"F"<"G"<..: 2 2 2 6 7 7 6 5 2 5 ...
##  $ clarity: Ord.factor w/ 8 levels "I1"<"SI2"<"SI1"<..: 2 3 5 4 2 6 7 3 4 5 ...
##  $ depth  : num  61.5 59.8 56.9 62.4 63.3 62.8 62.3 61.9 65.1 59.4 ...
##  $ table  : num  55 61 65 58 58 57 57 55 61 61 ...
##  $ price  : int  326 326 327 334 335 336 336 337 337 338 ...
##  $ x      : num  3.95 3.89 4.05 4.2 4.34 3.94 3.95 4.07 3.87 4 ...
##  $ y      : num  3.98 3.84 4.07 4.23 4.35 3.96 3.98 4.11 3.78 4.05 ...
##  $ z      : num  2.43 2.31 2.31 2.63 2.75 2.48 2.47 2.53 2.49 2.39 ...
Our first graph?
ggplot(diamonds, aes(x=cut, y=carat))
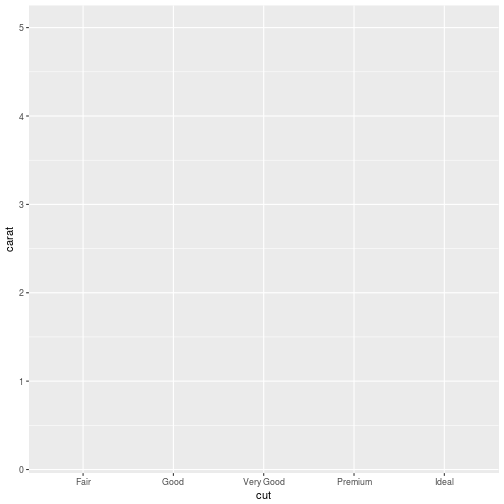
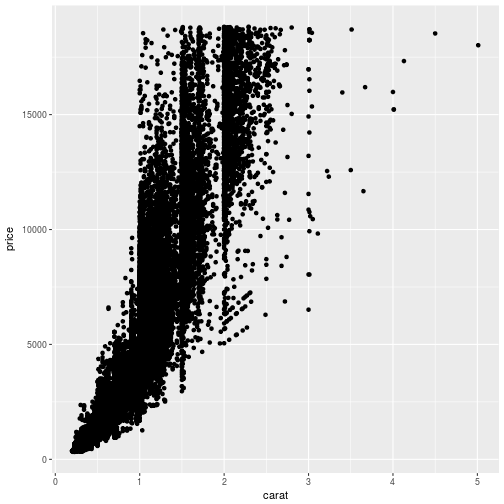
We’ve defined the structure of our graph, but we need to add a “layer” to it in order to define what type of graph it is. Let’s make a scatterplot:
ggplot(diamonds, aes(x=carat, y=price)) +
  geom_point()

You can also save the structure of the graph to a variable and then add layers and other attributes to it. Let’s do that:
g <- ggplot(diamonds, aes(x=carat, y=price))
g + geom_point()
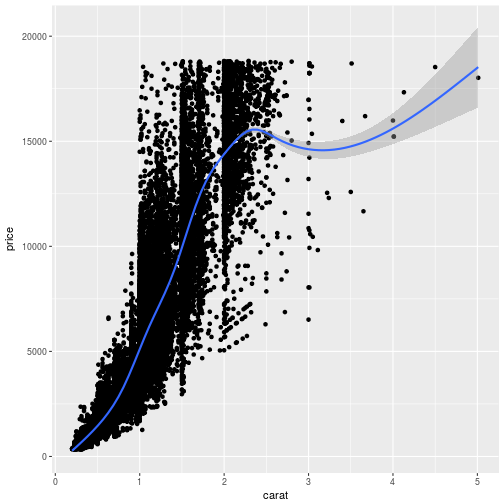
We can add other “layers” of graphs to our first graph. Let’s add a trend line to our scatterplot:
g + geom_point() + geom_smooth()
## `geom_smooth()` using method = 'gam'
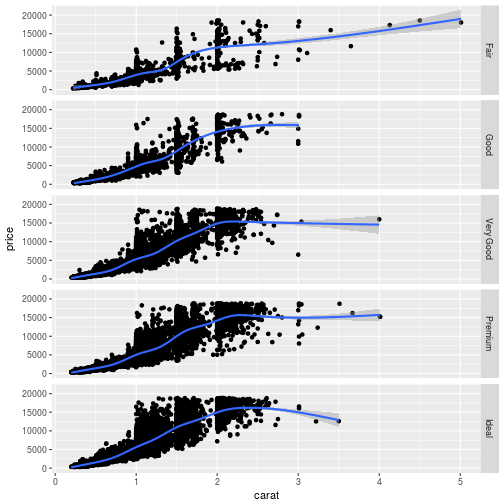
We can also “facet” our graphs, which means dividing a plot into subplots based on the values of one or more discrete variables.
g + geom_point() + geom_smooth() + facet_grid(cut~.)
## `geom_smooth()` using method = 'gam'
There are lots of ways to organize your facet. See “faceting” at the bottom of ggplot cheetsheet.
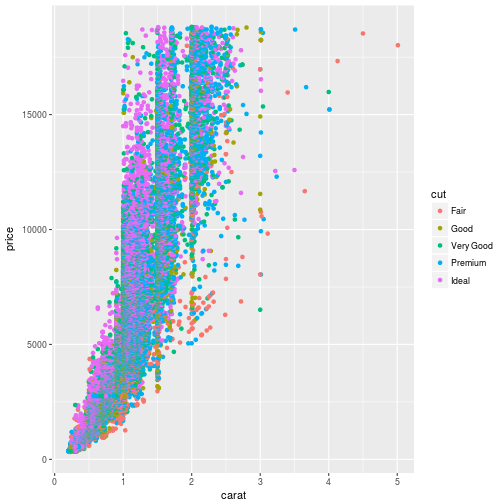
Let’s say we don’t want to facet, but we want to colour the dots depending on the cut of the diamonds:
ggplot(diamonds, aes(x=carat, y=price, color=cut)) + geom_point()
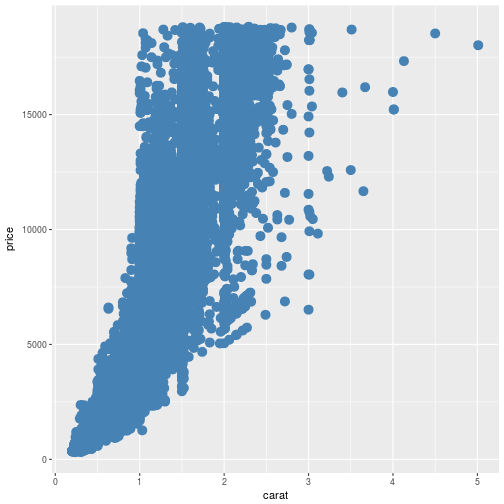
We can also change some aesthetic features of the graph. Let’s get rid of the color aspect of our structure and change the colour and size of the points:
ggplot(diamonds, aes(x=carat, y=price)) + geom_point(color="steelblue", size=4)
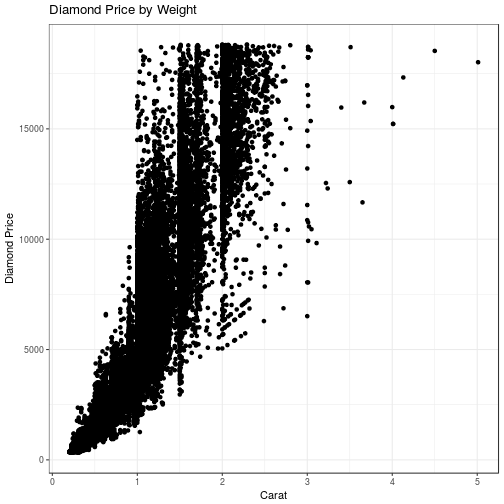
Let’s look at how to change the theme and labels:
g + geom_point() +
  ylab("Diamond Price") +
  xlab("Carat") +
  ggtitle("Diamond Price by Weight") +
  theme_bw()
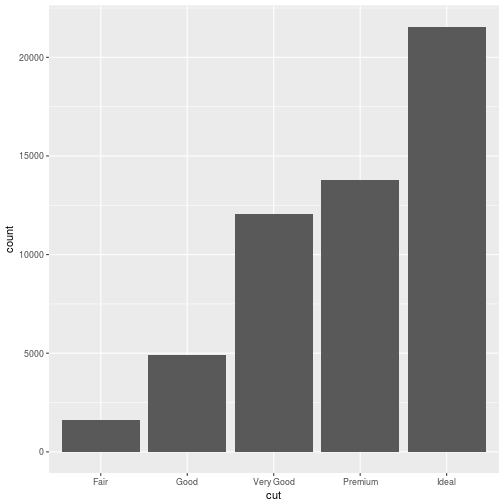
What about a bar plot? Let’s find out how many diamonds of each cut are in the dataset.
ggplot(diamonds, aes(cut)) + geom_bar()
What about making interactive graphs in R? There is a package called plotly that lets us make our ggplot2 graphs interactive:
library(plotly)
## Error in library(plotly): there is no package called 'plotly'
g <- ggplot(diamonds, aes(cut)) + geom_bar()
p=ggplotly(g)
## Error in eval(expr, envir, enclos): could not find function "ggplotly"
p
## Error in eval(expr, envir, enclos): object 'p' not found
Finally, here is qplot, a way of making super quick scatterplots in R.
qplot(carat, price, data = diamonds)

MORE RESOURCES ON GGPLOT2
r graph gallery for inspiration (not just limited to ggplot2 graphs)